Real-time sound spectrography using Atmega1284
|
|
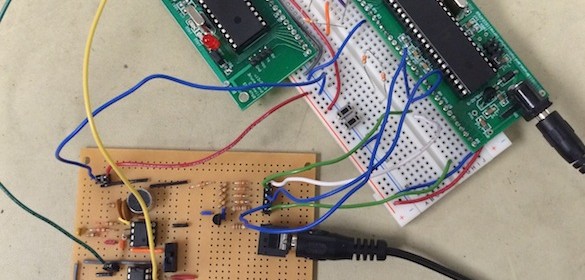
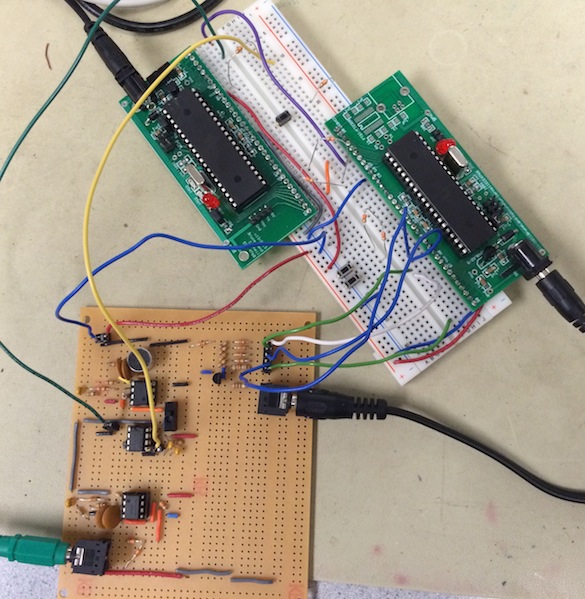
A sound spectrogram is a visual representation of the frequency components contained in an audio signal. The device that generates the spectrogram is called spectrograph. In a spectrogram, the horizontal axis is time and the vertical axis represents frequency. The spectrogram is color coded or gray-scaled to represent the relative intensity of the sound in each frequency region and time. Some of the applications of spectrograms are speech analysis and enhancement, studying bird and animal calls, music formation, etc. During pre-computer era, the spectrograms were generated using analog techniques that involved a series of bandpass filters. With the advent of digital signal processing, the most common approach of doing sound spectrography these days is through Fast Fourier Transform (FFT) of the time domain audio signal. Varun, Hyun, and Madhuri are EE students at Cornell and they have implemented a FFT-based real-time sound spectrography using two Atmega1284 processors as their final project for the ECE4760 Digital Systems Design Using Microcontrollers class. The two processors have different responsibilities. The first one is a dedicated audio processor, which receives the input audio signal from a 3.5mm audio jack or microphone, digitize it, and convert it into frequency domain using a 128-point FFT. The second processor is in charge of receiving the FFT data from the Audio processor and generating and outputting a real-time 4-bit grayscale histogram on a TV screen in real-time. Tact switch inputs are also implemented to allow the user to control play/stop, or to change the scrolling speed and the vertical scaling of the display.
Real-time sound spectrography using Atmega1284
Here is their demo video.
|
|
Pingback: Cornell U ECE4760 Arduino projects | tlfong01