In-Circuit Debugging of PIC microcontrollers
|
|
An In-Circuit Debugger (ICD) is a very powerful and effective tool for real-time debugging of a microcontroller-based system at hardware level. It allows you to run, halt and single step the program while the target microcontroller is embedded in the actual circuit. Once halted, the program variables, Special Function Registers (SFRs), RAM and EEPROM locations can be examined and modified in real-time, thus assists the designer in debugging the firmware and hardware together. In this article, I am going to describe the In-Circuit Debugging technique in PIC microcontrollers, and demonstrate the debugging procedure with a test project using the PIC16F887 microcontroller. Although the operation of most ICDs are similar, here I will be using mikroElektronika’s PICFlash with mikroICD device in conjunction with the mikroC Pro for PIC compiler for illustrative purpose.

Use of ICD in debugging PIC programming
Theory
An ICD is a hardware device that is connected between a PC and the target microcontroller to debug real-time applications quickly and easily. The ICD is controlled by a debugging application tool running on the PC. The debugging tool allows the designer to slow down the microcontroller operation by inserting breakpoints into the program 0r single-step the program execution. After the execution of a single or a group of instructions, the values of the program variables and internal registers can be examined, and modified if required. This helps to quickly identify bugs and errors in the source code and thus expedite the development process of the project.
ICD in PICMicro
In PIC microcontrollers, in-circuit debugging is achieved through the same pins that are used for In-Circuit Serial Programming (ICSP), i.e. ICSPDAT (or PGD), ICSPCLK (or PGC), VPP/MCLR (programming mode voltage), VDD (power supply voltage), and VSS (Ground). This allows manufacturers to integrate ISCP programming and in-circuit debugging features into a single device. During debugging, the ICD device adds an additional block of code (along with the user application) to the target microcontroller’s program memory, which interacts with the debugging application and sends variable values, internal register values and other details to the PC through the same programming cable.
For example, Microchip’s MPLAB ICD2 and ICD3 are both programmer and real-time debugger for selected PIC MCUs and dsPIC DSCs. The functionality of the ICD is controlled by the MPLAB Integrated Development Environment (IDE) application software running on the PC. During debugging all available features of the target microcontroller are accessible interactively through the MPLAB IDE interface. These functions allow you to run the program in single-step mode, insert breakpoints into the program, examine the registers and variables, and modify them if desired.
Although an ICD is an invaluable debugging tool, it does not come at no cost. The two main disadvantages of ICD are: 1) it uses some memory of the target microcontroller, and 2) it occupies a few I/O pins of the target microcontroller to communicate with the PC. Therefore, while debugging, the PGD, PGC, and MCLR pins of the target microcontroller cannot be used for any other purposes.
PICFlash with mikroICD
The PICFlash with mikroICD is a programmer and in-circuit debugger for PIC12, PIC16, and PIC18 series microcontrollers. It is manufactured by mikroElektronika and is supported by all of its PIC compilers (mikroC, mikroBasic, and mikroPascal). The device communicates with PC through an USB interface, which also provides the necessary power for the ICD. ?It connects to the target PIC microcontroller through the PGC, PGD, VPP/MCLR and power supply pins. When this device is used as an standalone programmer, the first three pins are released after the HEX file is loaded into the target PIC microcontroller. But if it is used for in-circuit debugging, those three pins are used for communicating with the PC and hence cannot be used for any other purposes.

PICFlash with mikroICD: Programmer + In-Circuit Debugger
Installing software for PICFlash with mikroICD
You can find the detail information about this in the mikroICD manual. The easiest way to setup this device is to download the PIC compiler first. Note that this device does not work with any other party’s compiler, so you need one of mikroElektronika compilers to make it work. The following steps describes the software installation and setup of PICFlash with mikroICD for mikroC Pro for PIC compiler.
- First, download mikroC Pro for PIC compiler from HERE and install it on your PC.
- When the installation is complete, it will ask if you want to install mikroProg Suite for PIC. Say yes, and install that too.
- Next, it will ask if you want to install the drivers for mikroProg programmer. Say yes, and select the driver file suitable to your operating system, and install it. You are done!
Using PICFlash with mikroICD for Debugging
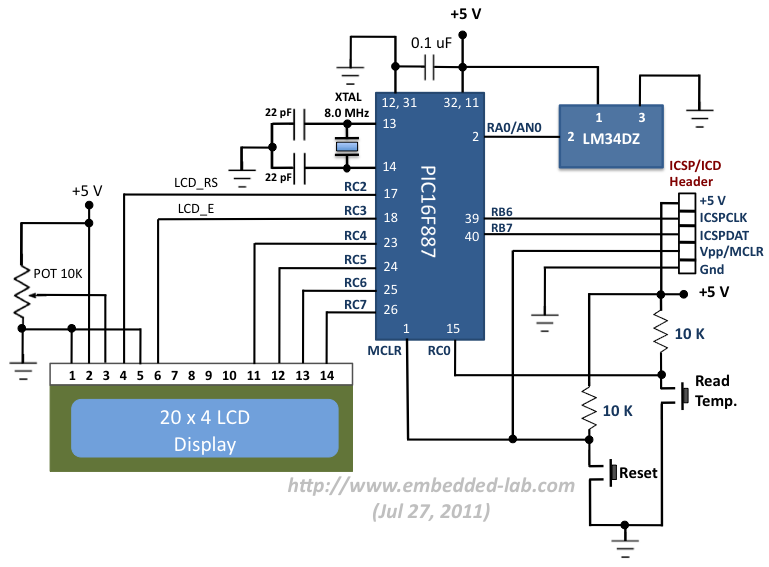
The first step of using the mikroICD is writing an application program in the chosen compiler, say mikroC Pro for PIC. The compiler’s IDE provides debugging functions such as running the program step by step, pausing the program execution using breakpoints, examining the state of the internal registers, tracking the values of variables in the program, etc. Please read the mikroICD manual for further detail. I will be illustrating the debugging procedure with our test project that uses PIC16F887 microcontroller and LM34DZ sensor to measure the ambient temperature and display it on LCD. The circuit diagram for this project is shown below and is self-explanatory. The way it works is every time the Read Temp. switch is pressed, the microcontroller reads the temperature sample from the LM34DZ and displays it on the LCD. You can see that under default condition, the switch output is High, and it goes Low when the switch is pressed. I am using mikroElektronika’s PIC Ready 1 board for this experimental setup. It is a quick prototyping board for 28 and 40 pin PIC microcontrollers. The board comes with a PIC16F887 microcontroller, preloaded with a serial bootloader, which is actually not applicable in our case. However, the board does contain connectors for PICFlash with mikroICD too. The user’s manual for PIC Ready 1 board describes more about the on-board connections.

Circuit diagram for debugging a PIC16F887 microcontroller system

Experimental setup: PIC-Ready1 board and PICFlash with mikroICD
So let me briefly describe the whole scenario once again, so that it would be more clear what we are trying to do here. We have a PIC16F887 microcontroller circuit that is set up to read the analog output of LM34DZ sensor, convert it into temperature (°F), and display it on a LCD. The microcontroller is connected to a mikroICD (PIC programmer + ICD) through ICSP pins. The mikroICD is also connected to the PC through USB port. The mikroICD debugging tool is embedded into the mikroC Pro for PIC compiler and hence can be operated from there. We will use the debugging tool for single stepping of the program loaded into the microcontroller and watch the variable values. Meanwhile, with the execution of each instruction, its effect can also be observed in the real hardware circuit.
mikroICD Debugging procedure
First of all create a new project with the following source code to read the LM34DZ output and display the measured temperature on the LCD screen. If this is your first experience with mikroC compiler, please read Creating first project in mikroC Pro for PIC to learn how to create a new project in mikroC Pro for PIC. Before compiling, go to Edit Project window and select the build type as ICD Debug. This option will let the mikroICD to load the debug code along with the user application into the microcontroller.
/*
 * Project name:
     Testing mikroICD debugging tool with PIC16F887
 * Copyright:
     (c) Rajendra Bhatt
 * Test configuration:
     MCU:             PIC16F887
     Oscillator:      HS, 10.0000 MHz
*/

// LCD module connections
sbit LCD_RS at RC3_bit;
sbit LCD_EN at RC2_bit;
sbit LCD_D4 at RC4_bit;
sbit LCD_D5 at RC5_bit;
sbit LCD_D6 at RC6_bit;
sbit LCD_D7 at RC7_bit;

sbit LCD_RS_Direction at TRISC3_bit;
sbit LCD_EN_Direction at TRISC2_bit;
sbit LCD_D4_Direction at TRISC4_bit;
sbit LCD_D5_Direction at TRISC5_bit;
sbit LCD_D6_Direction at TRISC6_bit;
sbit LCD_D7_Direction at TRISC7_bit;
// End LCD module connections

char txt[] = "Temp =      F";
char *temp = "000.0";
sbit PressSwitch at RC0_bit;
unsigned int ADC_Value;
void main() {

  ANSEL  = 0x01;                 // Configure RA0 as Analog input
  ANSELH = 0x00;
  TRISA  = 0xff;
  C1ON_bit = 0;                  // Disable comparators
  C2ON_bit = 0;
  TRISC = 0x01;                  // RC0 is input
  TRISD = 0x00;
  TRISB = 0xFF;
  txt[11] = 223;                 // ASCII value for degree symbol
  Lcd_Init();                    // Initialize LCD
  Lcd_Cmd(_LCD_CLEAR);           // Clear display
  Lcd_Cmd(_LCD_CURSOR_OFF);      // Cursor off
  Lcd_Out(1,1,txt);              // Write text in first row

  do {

    if (!PressSwitch) {               // Detect logical 0
      Delay_ms(300);
      ADC_Value = ADC_Read(0);
      ADC_Value = ADC_Value*4.88;     // Convert to temperature in F
      temp[0] = adc_value/1000 + 48;
      temp[1] = (adc_value/100)%10 + 48;
      temp[2] = (adc_value/10)%10 + 48;
      temp[4] = adc_value%10 + 48;
      Lcd_Out(1,7,temp);
    }

  } while(1);                         // Endless loop
}

Selecting ICD Debug for build type allows in-circuit debugging
You save this scheme and then click on Build + Program (or hit F4) to compile the program and load it into the target microcontroller. The mikroICD must be connected to the PC’s USB port as well as to the target microcontroller. It will automatically launch mikroProg Suite for PIC, which is the application software required on the PC to transfer the HEX file into the micrcontroller. Now the application and the debug code are both loaded, it is time to use the debugging functions and see how it works.
To start debugging, select the Start Debugger option from the Run drop-down menu or use the function key [F9]. Now you can execute the program line by line by pressing [F8] key. During execution, the program line to be executed next is highlighted in blue by default (see figure below).

Next instruction to be executed is highlighted in blue
The real-time execution of the program can be monitored on the Watch Window. You can select whatever registers and variables you want to monitor and add them to the Watch Window. Go to View -> Debug Windows -> Watch Window option to get the Watch window. Select the variables that you want to observe from the variable list and add them to the window by clicking on the + sign shown. In the figure below, I am monitoring four variables during debugging. They are ADC_Value, PressSwitch, ADRESH, and ADRESL. The ADC_Value is the user defined integer variable that stores the 10-bit A/D result. PressSwitch is the input port RC0, which is high because the tact switch is open. ADRESH and ADRESL are 8-bit internal registers that store the 10-bit A/D conversion result. The least significant 8-bits are stored in ADRESL and the remaining 2 most significant bits are stored in ADRESH.

Adding registers and variables to watch window
As I mentioned earlier, in in-circuit debugging whenever an instruction is executed, its effect is also observed in the real hardware circuit. For example, when the LCD_Init() routine is executed, a blinking cursor appears on the LCD screen. This tells you that the LCD_Init() routine and your LCD hardware interface are both working well.

A blinking cursor appears when LCD_Init routine is executed
Keep hitting on the [F8] key until the Lcd_Out(1, 1, txt) is executed, and you will see the ‘txt’ string displayed on the LCD. Carry on hitting the [F8] function key and the single-stepping will continue until the if (!PressSwitch) condition is arrived. By default, the Read Temp switch is open and PressSwitch is ‘1’, so the If condition is not met. Therefore, if you hit the [F8] key again, the execution will jump to the while(1) statement. It will continue doing back and forth between if and while statements until you press the Read Temp switch on the circuit board.

Waits until the Read Temp key is pressed
When the if(!PressSwitch) instruction is highlighted in blue, press the Read Temp switch and hit [F8], and the execution gets inside the if statement. The execution will be single-stepping again with pressing of [F8] key. When the ADC_Read(0) is executed, the values of ADC_Value, ADRESH, and ADRESL also change in the Watch Window.

Execution within the if statement begins upon pressing the Read Temp button (PressSwitch = 0)

ADC_Value in Watch Window shows the ADC result
Next, the ADC_Value and temp variables are updated and the temperature in °F is displayed on the LCD when Lcd_Out(1, 7, temp) is executed.

Displaying ADC_Value on LCD
Thus, in this simple example, we saw how the PIC16F887 microcontroller was slowed down to single-step mode during in-circuit debugging, and the program variables are watched at the execution of each program line. In case the application program is too big, say hundreds of lines of instructions, single-step debugging will be very time-consuming and inconvenient. To deal with those circumstances, the mikroICD debugging tool offers run to cursor [F4] and breakpoint features to fasten the debugging process. With [F4] function key, you can let the execution of the program until reaching the cursor position. Similarly, the use of breakpoints allows to place intentional stops at desired program lines. The summary of various debug function keys in mikroICD are shown in the table below. Besides, during debugging you can also modify the values of the program variables from the Watch Window. The more advanced features of mikroICD debugging tool are described in the user’s manual.

Major function keys in mikroICD debugging tool
|
|
Pingback: way to see the adc value in pic16f785
Pingback: In-Circuit Debugging of PIC microcontrollers :Embedded Lab | Electronics Blog
Thank u!. It worked. This is same crt i setup, but i rewired PORTC. My temperature is reading in Celsius but not fahrenheit degrees. R u sure u’re measuring in C degrees? But i didn’t added read temp’s button.
Pingback: Making the case for in-circuit debugging tools | The Depot of Talk
Pingback: Making the case for in-circuit debugging tools | You've been blogged!
Pingback: Making the case for in-circuit debugging tools - Hack a Day