Gesture glove to vocalize sign language
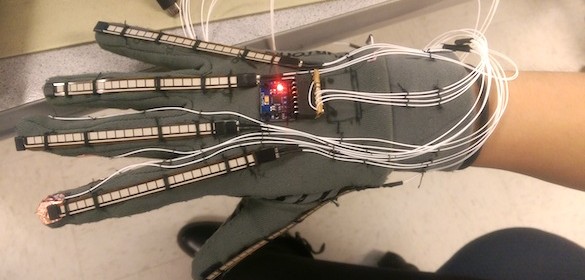
The Fall semester of 2014 is now over and we get to see some new and exciting embedded projects from students of Cornell published on Bruce Land’s ECE4760 class website. Monica Lin and Roberto Villalba have made a gesture glove for people with hearing disabilities. This device is intended to help them to better communicate with other people by converting their gestures into speech. For their project, they used five flex sensors to sense and quantify the bending of each finger, and the MPU-6050 (a 3-axis gyroscope and a 3-axis accelerometer) sensor to detect the orientation and rotational movement of the hand.
Read more