RGB audio visualizer using FPGA

|
|
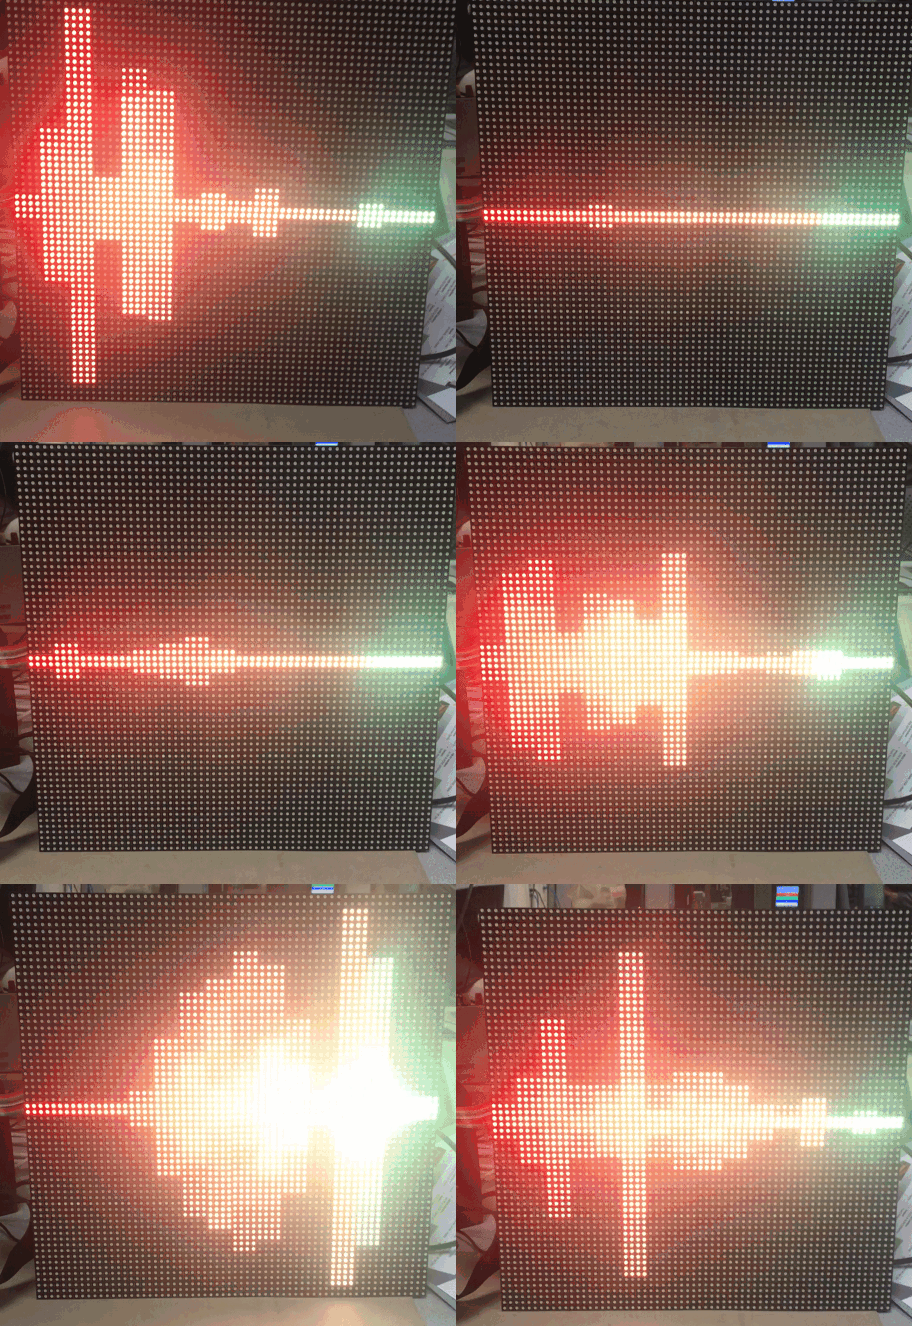
Sam Miller, Sahil Gupta, and Mashrur Mohiuddin built a 64×64 RGB LED matrix audio visualizer as their final project for the ECE5760 Microcontroller Design course at Cornell. The visualizer responds to a musical input in real time with a graphic animation on the RGB panel using vertical bars, balls, and particle to enhance the user’s listening experience. The RGB visualizer runs off of an Altera DE2-115 FPGA, which handles all the controls and processing of data for the 64×64 LED Matrix as well as the beat detection and audio output.
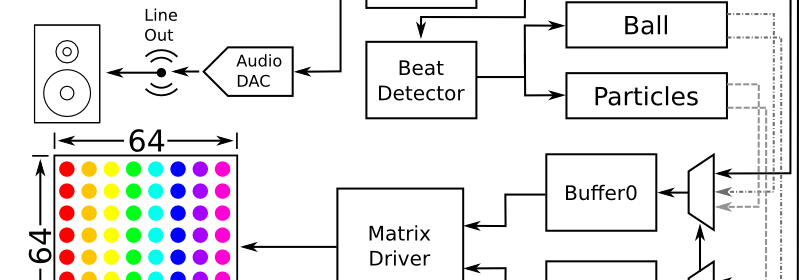
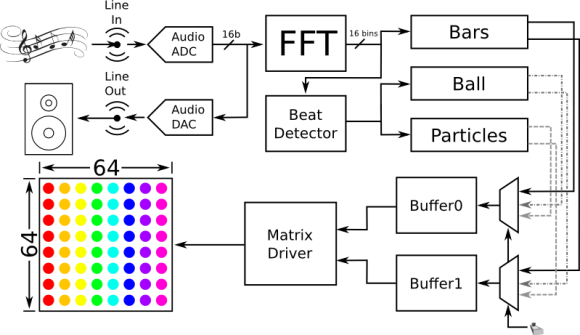
Our system starts with a musical input from the 3.5mm line-in input from the FPGA. This analog input is fed through an ADC to digitize the signal at a sampling rate of 48kHz. This signal is fed back through a DAC to the line-out port into speakers in order to play the audio. After the ADC, the audio signal is separated into its frequency components through our FFT module. These frequency components are used in a beat detection algorithm to detect large changes in signal energy, which correspond to beats in the song. The bars mode of the visualizer uses the frequency components directly, while the ball and the particle mode only use the beat of the song. Each of these 3 modules uses their inputs to calculate the coordinates and corresponding colors of each LED in the matrix. The outputs of the modules are muxed and written to two buffers (since the matrix writes to two LEDs simultaneously). From here, another module reads the contents of the buffer, and drives the LED matrix via the GPIO pins on the FPGA.
|
|

