chipKIT Project 2: Temperature and relative humidity logger
|
|
This project is about building a PC-based temperature and relative humidity logger using the chipKIT Uno32 board and the DHT11 sensor. The project setup requires no additional wires (other than the USB cable) and components; the DHT11 sensor is directly plugged into four I/O pins of the Uno32 board and the project is ready to go. This could be a handy and an easiest way to setup an ambient room monitoring system for a server room. The Uno32 reads the temperature and relative humidity from the DHT11 sensor at preset interval and sends the data to PC through the USB-UART interface. A PC application is developed using the open-source Processing programming platform to log data onto an ASCII file. The PC application also displays the real-time temperature and relative humidity on computer screen.

PC-based logger for temperature and relative humidity
Theory
DHT11 is an inexpensive sensor that provides calibrated digital outputs for ambient temperature and relative humidity. It comes in a single row 4-pin package and operates from 3 to 5.5V power supply. It can measure temperature from 0-50 °C with an accuracy of ±2°C and relative humidity ranging from 20-95% with an accuracy of ±5%. It has got its own proprietary 1-wire protocol, and therefore, the communication between the sensor and a microcontroller is not possible through a direct interface with any of its peripherals. The protocol must be implemented in the firmware of the MCU through bit-banging of an I/O pin. Please read
Measurement of temperature and relative humidity using DHT11 sensor and PIC microcontroller for more details on the DHT11 communication protocol. The following picture describes the four pins of the DHT11 sensor.

DHT11 pins
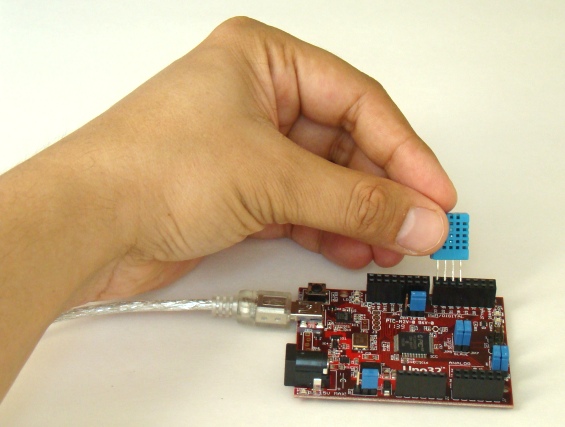
In this project, four pins of the DHT11 sensor is directly inserted into four I/O pins (7, 6, 5, and 4) of the Uno32 board. The power supply (1), data (2), and ground (4) pins of DHT11 go to I/O pins 7, 6, and 5 of the Uno32, respectively. The Uno32 pins 7 and 4 are configured as output pins and are set to High (3.3V) and Low (Gnd), respectively, through software to power the DHT11 sensor. Note that an I/O pin of Uno32 can source up to 18mA current that is sufficient to power the DHT11 sensor, which only requires less than 5mA during data conversion and transfer. Pin 3 of DHT11 is unused. Temperature and humidity bytes are read through I/O pin 6 of the Uno32.

Inserting DHT11 on to I/O pins 7-4 of Uno32

Complete setup of the project
chipKIT sketch
Writing firmware is easier with the use of the DHT11 library available for Arduino or chipKIT platform. The DHT11 library for Arduino was originally written by George Hadjikyriacou and was later modified by other people. Make sure you include the library in your chipKIT sketch. The following sketch is for Uno32 to read the temperature and relative humidity data (two bytes) from the DHT11 and send them over the serial port. The sampling interval is set to 2 seconds.
/* Project 2: PC-based temperature and humidity logger Description: The DHT11 sensor is used to measure the ambient temperature and relative humidity. The measured values are displayed on a PC and logged into a ASCII file through an application written using Processing. Board: chipKIT UNO32 */ #include "dht11.h" #define VCCPIN 7 #define DHT11PIN 6 #define GNDPIN 4 dht11 DHT11; void setup() { Serial.begin(9600); pinMode(VCCPIN, OUTPUT); pinMode(GNDPIN, OUTPUT); digitalWrite(VCCPIN, HIGH); digitalWrite(GNDPIN, LOW); }/*--(end setup )---*/ void loop() { int chk = DHT11.read(DHT11PIN); Serial.write(DHT11.humidity); Serial.write(DHT11.temperature); delay(2000); } |
Download the complete chipKIT sketch and library files
On PC’s side, the open source programming language Processing is used to develop an graphical application to display the received temperature and humidity information. Processing is an open-source software development environment designed for simplifying the process of creating digital images, animations and interactive graphical applications. It is free to download and operates on Mac, Windows, and Linux platforms. I have written a simple application here that receives the temperature and humidity bytes sent by the Uno32 board through the serial port, and display those information on a graphical window. The data logging part records the temperature and humidity samples plus date and time stamps on an ASCII file. The date and time are based on the PC’s RTC.
You should import the Processing Serial library first before accessing the serial port. This can be done by,
import processing.serial.*;
Next, you can open a serial port as
Dev_Board = new Serial(this, "COM12", 9600);
In my case the USB-UART module on Uno32 board appears as COM12. You should find the right COM number to make it work for you. In Windows machine, you can find this information from the Device Manager tool.
A clickable Start/Stop button is provided on the display window. The Processing Mouse functions are used to detect a mouse press over the button. When the Start is pressed, data logging begins and the label on the button changes to ‘Stop’. If Stop is pressed, the data logging is paused. The temperature samples are recorded along with the date and time stamp (from PC) into an ASCII file. Every time the Start is pressed, the program creates a new ASCII log file. The name of the file contains the current system date and time so that there won’t be any overwriting of files. However, the data are temporarily stored into the PC’s RAM and are transferred to the ASCII file on the hard drive only after pressing the Stop button.
Download the Processing source and applications
The following picture is a screenshot of the output window on PC.

Output on computer screen
Here’s a sample of the output ASCII file where the temperature and relative humidity information are logged along with the time stamps.

Output record file
The data from the log file can be read and plotted to generate graph using applications like MS Excel, or even the given Processing code can be modified further to plot the temperature and relative humidity vs time.
|
|
hey R-B, how can i attach a pressure sensor to this module
Thanks R-B for you excellente article!!
With the aid of the very precise guide provided by Stewart
(http://scruss.com/blog/2014/01/07/processing-2-1-oracle-java-raspberry-pi-serial-arduino-%E2%98%BA/comment-page-1/#comment-1077360)
I´ve just managed to run my sketch on my Raspberry Pi B+, on Raspbian release 2015-02-16. I downloaded jSSC-2.8.0-Release.zip and installed Java 7, as per Stewart´s indications.
Although I have a Chipkit max32, I used an Arduino Uno instead, and a DHT22 sensor.
Your article served me as inspiration and guide, as it was my first try at Processing.
Every thing is running smoothly!! I will atempt now to export it as a standalone app.
Thanks again!
Bill
Hi, I found your program very interesting, especially the part of datalogger on processing, I’m new in processing, and didn’t know you could do a graphical interface for arduino, I worked with labview to do that, but I quite interested on your method. Could you share me your code to learn, and adapt it to my projects?
Thanks,
Denisse Suárez
memise90@gmail.com
It is here:
http://www.embedded-lab.com/uploads/Processing/P2_DHT11_logger.zip
i want more information of software of temperature and humidity logger.
Dear Sir,
I didnt get the output when i download the dht11 files and processing the .pde code in the Processing Tool. I didnt get the output. Eventhough i am having the chipkituno32 with DHT11 toolkit. properly..
Please help me out of this As soon as possible. Mail me in prasannaravi93@gmail.com
Thanks in advance pls reply;
Dear sir , i have a question please
i tried your application and it is wonderfull but i writes the data to the text file after a prees STOP
can i modify the code to to start writing after i press START ?
thank you in advace for your help
dear sir.,
we need to have details on data loggers for both temperature and RH ., please send us more details on the same to move further on thiss.,
k shiva
098422 03545
0887000 3545.,