Making a SPL dB Meter
|
|
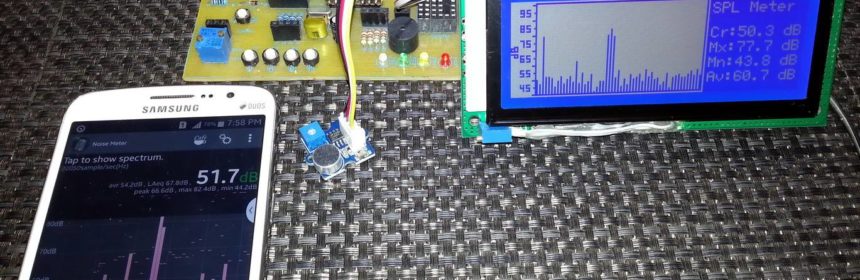
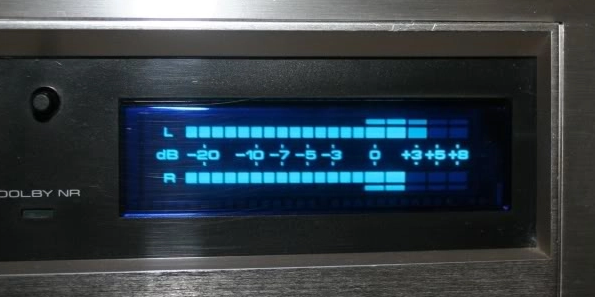
In the 1980s, there was no internet as like today and so the sources of entertainment were televisions, radios and cassette players. When I was a kid, we had an audio cassette player. We used it to play songs but my imagination was always fixed to its VU meter display with its fancy readings as shown below. It changed with the volume of the speakers and matched rhythmically with the sound coming out of it. During my engineering career, I got to know about the Decibel scale and sound pressure measurement. It soon became a goal for me to design an audio dB meter and recreate my child memories. In this tutorial, I will show how to make a dB meter that is accurate enough for general uses.
Background and Application
Sound needs a medium for propagation or travel. It can’t travel in vacuum. Normally air is that medium but sound can also propagate in liquids and other states of matter. I am not going to lecture on how sound travels and its properties as Wikipedia details everything well here. Everything we see around us has a measurement and a unit. In case of sound pressure, the unit is decibel. Our basic requirement is to be able to measure Sound Pressure Level (SPL) in decibel scale with a typical 8-bit microcontroller, an ordinary microphone and without involving complex algorithms.
Measurement of sound has a number of uses. For instance, monitoring sound pollution, security system, monitoring the quality of an amplifier, detecting sound profile of an environment, etc.
Selecting Microphone
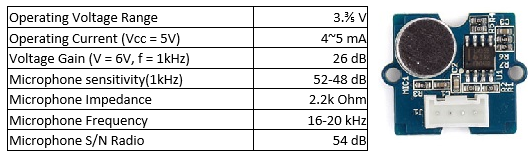
For the ease of work and for known parameters, I selected Seeedstudio’s Grove Sound Sensor which happens to have the following specs:
Seeedstudio – a Shenzhen, China-based component manufacturer and global component supplier, has a good reputation in the hobby-electronics community, particularly amongst Arduino and Raspberry Pi users. It is one of the most reliable electronics partners that make quality items at reasonable price tags.
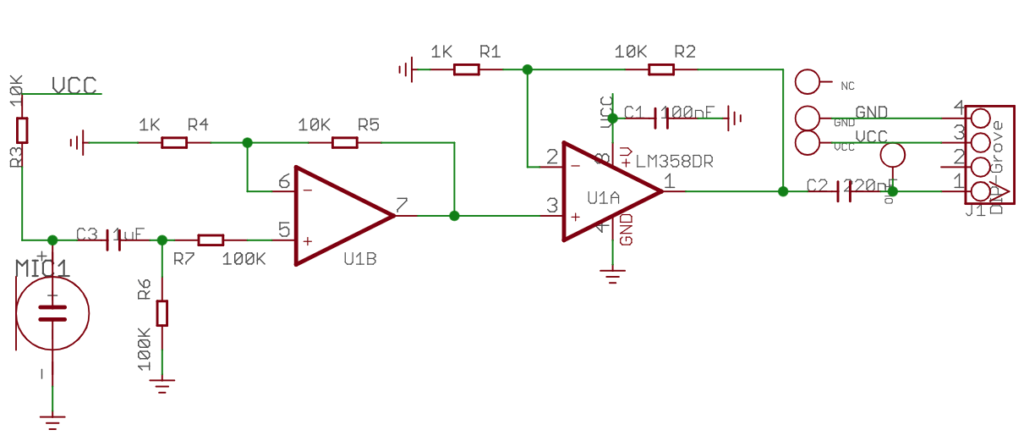
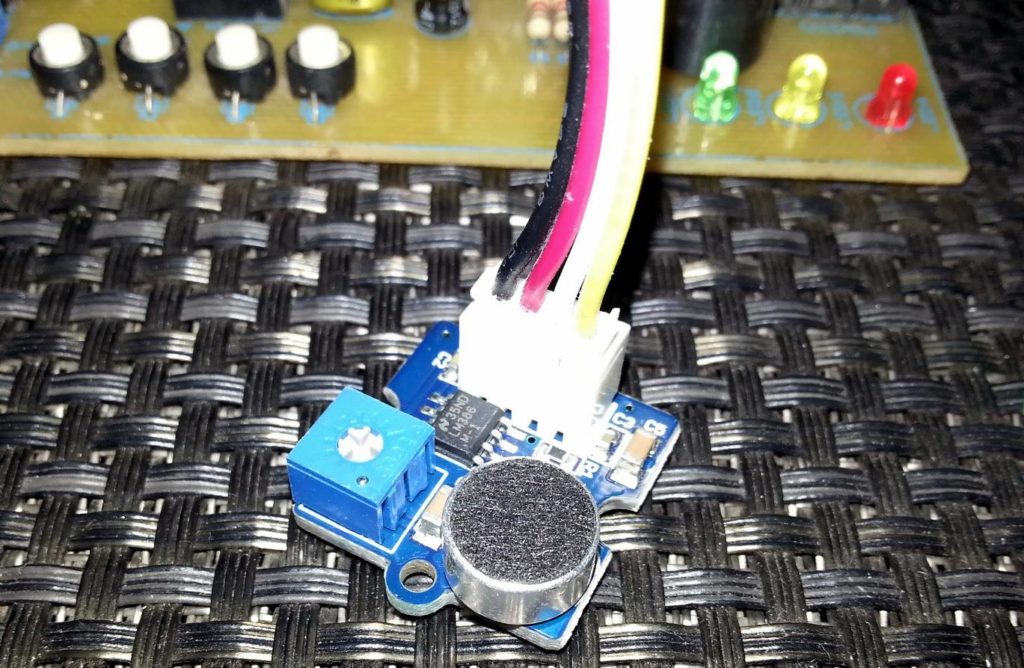
The Grove microphone module that Seeedstudio sells under the Grove product family banner consists of an electret microphone and a pair of general-purpose op-amps in non-inverting configuration that increase the gain roughly by 100 times. The sensor I used was an old version one and the main difference is an additional potentiometer to alter gain. Shown below is the schematic of the current version of the sensor:
The microphone module is itself very small. The Grove header and connector are simple and all products of Grove family share the same pin/header layout. The headers bring out power pins and signal pin(s). Grove connectors connect with these headers in one way only and the connectors have properly colored-wires. Thus, there is literally no chance of accidental wrong connections. The same type of header brings out the needed connections from the microphone module. We just have to connect them to our host microcontroller and power supply.
The Math
The specs of the microphone in the Grove Sound Sensor suggests that it has a sensitivity of 52 – 48dB at 1kHz spectrum. Therefore, it is best to consider an average sensitivity of 50dB.
The formula for sensitivity is as follows:
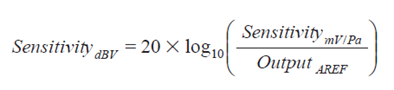
where Output AREF is typically 1000 mV/Pa (1 V/Pa) reference output ratio.
Thus, the sensitivity of the microphone in mv/Pa is found by going on the other side of the formula as shown in the following steps:
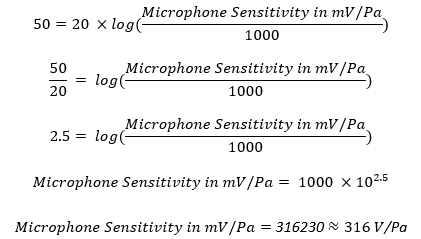
Going back to the schematic of the microphone module, we see that the original signal is amplified by about 100 times and so the actual sensitivity of the microphone is calculated to be:

Microphone sensitivity is typically measured with a 1kHz sine wave at a 94dB sound pressure level (SPL), or with 1Pa pressure. This is a reference value. Thus, the SPL value is given by the following formula:
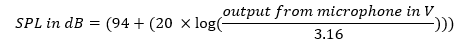
where 94 is the base value.
A dB reading of 40 represents near quietness while a dB reading of 95 represents the while of a train.
Schematic
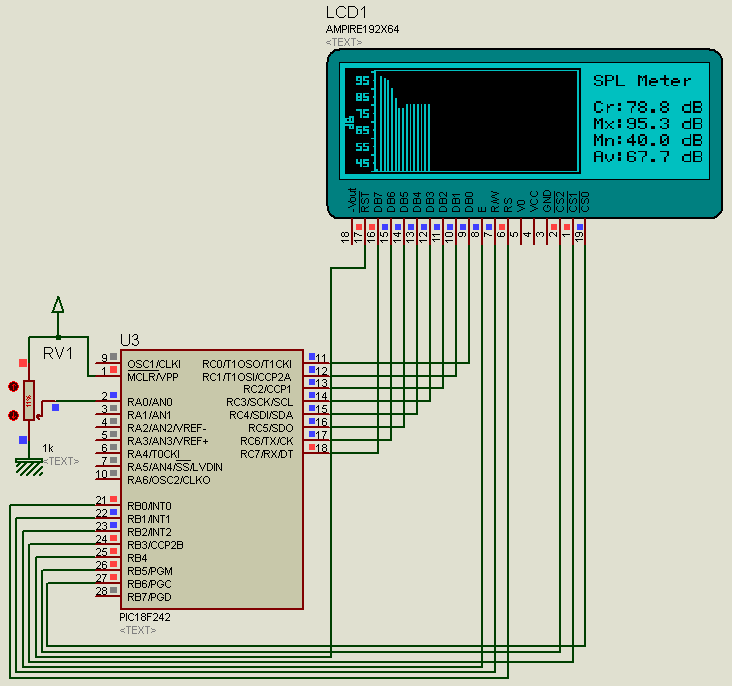
As can be seen, the above schematic was designed with Proteus VSM. There is no model for Grove Sound Sensor and so to mimic it, an interactive potentiometer was used in its place. Additionally, power and additional GLCD pins have been ignored in the schematic. However, those pins are present physically.
Coding
The code was written with CCS PIC C compiler and a PIC18F242 microcontroller was used for the project due to its large memories. CCS PIC C compiler’s coding style is similar to that of Arduino’s and so I guess nobody would be having any issue understanding the code.
The coding has two major parts. First is data collection and processing, and secondly, the graphical presentation of the collected data on a Graphical Liquid Crystal Display (GLCD).
#include #device *= 16 #device ADC=10 #fuses HS, PUT, NOWDT, PROTECT, CPD, BROWNOUT, BORV45 #fuses NOSTVREN, NOLVP, NODEBUG, NOCPB, NOWRT, NOWRTC #fuses NOWRTB, NOWRTD, NOEBTR, NOEBTRB, NOOSCSEN #use delay (clock = 10MHz) #define LARGE_LCD #define ref_SPL 94 #define sensitivity 3.16 #include #include "HDM64GS192.c" #include "graphics.c" #include "background_art.c" unsigned char txt_dB_msg[30] = {"SPL Meter"}; unsigned char txt_dB_current[30]; unsigned char txt_dB_max[30]; unsigned char txt_dB_min[30]; unsigned char txt_dB_avg[30]; unsigned char x = 17; float dB_max = 0.0; float dB_min = 100.0; float dB_avg = 0.0; float dB_current = 0.0; void setup(); void draw_background(); float adc_rms(); void read_SPL(); void display_redings(); void plot_data(); float map(float value, float x_min, float x_max, float y_min, float y_max); void main() { setup(); draw_background(); while(TRUE) { read_SPL(); display_redings(); plot_data(); delay_ms(400); } } void setup() { disable_interrupts(global); setup_WDT(WDT_off); setup_spi(spi_ss_disabled|spi_disabled); setup_timer_0(T0_internal); setup_timer_1(T1_disabled); setup_timer_2(T2_disabled, 255, 1); set_timer0(0); set_timer1(0); set_timer2(0); setup_ccp1(ccp_off); setup_ccp2(ccp_off); setup_ADC_ports(AN0); setup_ADC(ADC_clock_div_32); set_ADC_channel(0); glcd_init(on); glcd_fillscreen(0); memset(txt_dB_current, 0, 30); memset(txt_dB_max, 0, 30); memset(txt_dB_min, 0, 30); memset(txt_dB_avg, 0, 30); glcd_text57(130, 4, txt_dB_msg, 1, ON); } void draw_background() { unsigned long n = 0; unsigned char i = 0; unsigned char j = 0; unsigned char cs = 0; for(i = 0; i < 8; ++i) { output_low(GLCD_DI); glcd_writeByte(GLCD_LEFT, 0x40); glcd_writeByte(GLCD_RIGHT, 0x40); glcd_writeByte(GLCD_MID, 0x40); glcd_writeByte(GLCD_LEFT,(i | 0xB8)); glcd_writeByte(GLCD_RIGHT,(i | 0xB8)); glcd_writeByte(GLCD_MID,(i | 0xB8)); output_high(GLCD_DI); for(j = 0; j = 0) && (j 0) { read_adc(adc_start_only); while(!adc_done()); rms = read_adc(adc_read_only); tmp += (rms * rms); samples--; } tmp >>= 4; rms = (sqrt(tmp)); rms *= 0.004875; if(rms <= 0) { rms = 0.004875; } return rms; } void read_SPL() { dB_current = adc_rms(); db_current = (ref_SPL + 20 * log10(db_current / sensitivity)); if(db_current >= 99) { dB_current = 99; } if(x > 125) { db_max = 0.0; db_min = 100.0; x = 17; } if(dB_current > dB_max) { db_max = dB_current; } if(dB_current < dB_min) { db_min = dB_current; } dB_avg = ((db_max + dB_min) * 0.5); } void display_redings() { glcd_text57(130, 20, txt_dB_current, 1, OFF); sprintf(txt_dB_current, "Cr:%2.1g dB", db_current); glcd_text57(130, 20 , txt_dB_current, 1, ON); glcd_text57(130, 30, txt_dB_max, 1, OFF); sprintf(txt_dB_max, "Mx:%2.1g dB", dB_max); glcd_text57(130, 30 , txt_dB_max, 1, ON); glcd_text57(130, 40, txt_dB_min, 1, OFF); sprintf(txt_dB_min, "Mn:%2.1g dB", dB_min); glcd_text57(130, 40 , txt_dB_min, 1, ON); glcd_text57(130, 50, txt_dB_avg, 1, OFF); sprintf(txt_dB_avg, "Av:%2.1g dB", dB_avg); glcd_text57(130, 50, txt_dB_avg, 1, ON); } void plot_data() { unsigned char l = 0; l = map(dB_current, 40, 99, 61, 2); glcd_line(x, 2, x, 61, YES); glcd_line(x, l, x, 61, NO); x += 2; } float map(float value, float x_min, float x_max, float y_min, float y_max) { return (y_min + (((y_max - y_min) / (x_max - x_min)) * (value - x_min))); }
Explaining the Code
To efficiently collect data, the Root-Mean-Square (RMS) value of 16 raw output samples from the Grove Sound Sensor is taken and the value is converted from ADC counts to voltage. This way of sampling data ensures cancellation of unnecessary noise and glitches.
float adc_rms()
{
    unsigned char samples = 16;
    register unsigned long long tmp = 0;
    register float rms = 0.0;

    while(samples > 0)
    {
        read_adc(adc_start_only);
        while(!adc_done());
        rms = read_adc(adc_read_only);
        tmp += (rms * rms);
        samples--;
    }
    tmp >>= 4;
    rms = (sqrt(tmp));
    rms *= 0.004875;

    if(rms <= 0)
    {
        rms = 0.004875;
    }

    return rms;
}
The RMS voltage value from the sensor is then put to the derived formula discussed earlier. However, a microcontroller is not your ordinary calculator and it will behave erratically rather than showing an error symbol as in your calculator when it is forced to do a wrong calculation like dividing a value by zero. To avoid such incidents, the readings are checked for upper and lower hardware limits and confined if necessary, before processing and graphical representation.
Further data processing is done to determine the maximum, minimum and average SPL values.
void read_SPL()
 {
    dB_current = adc_rms();
    db_current = (ref_SPL + 20 * log10(db_current / sensitivity));
 if(db_current <= 40)    {        dB_current = 40;    }    if(dB_current >= 99)
    {
        dB_current = 99;
    }
 if(x > 125)
    {
       db_max = 0.0;
       db_min = 100.0;
       x = 17;
    }
 if(dB_current > dB_max)
    {
       db_max = dB_current;
    }
 if(dB_current < dB_min)
    {
       db_min = dB_current;
    }
 dB_avg = ((db_max + dB_min) * 0.5);
 }
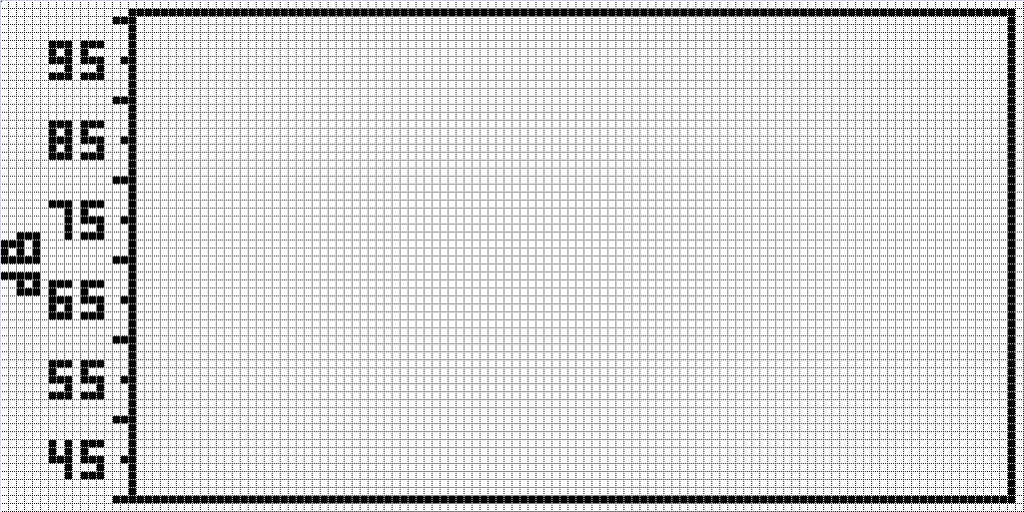
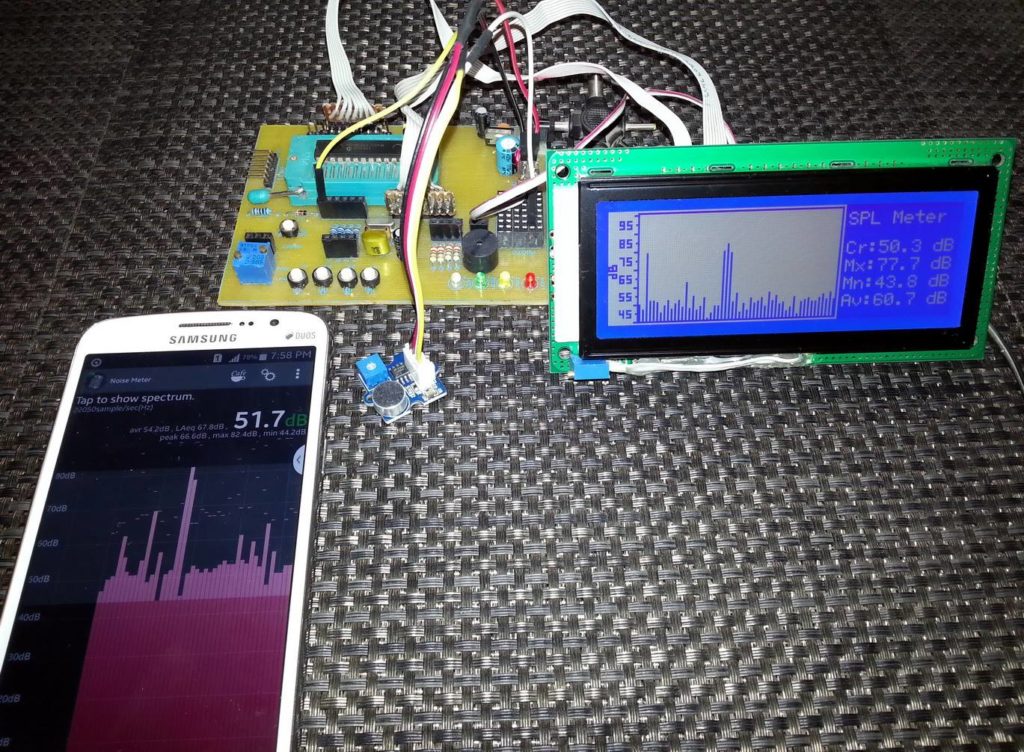
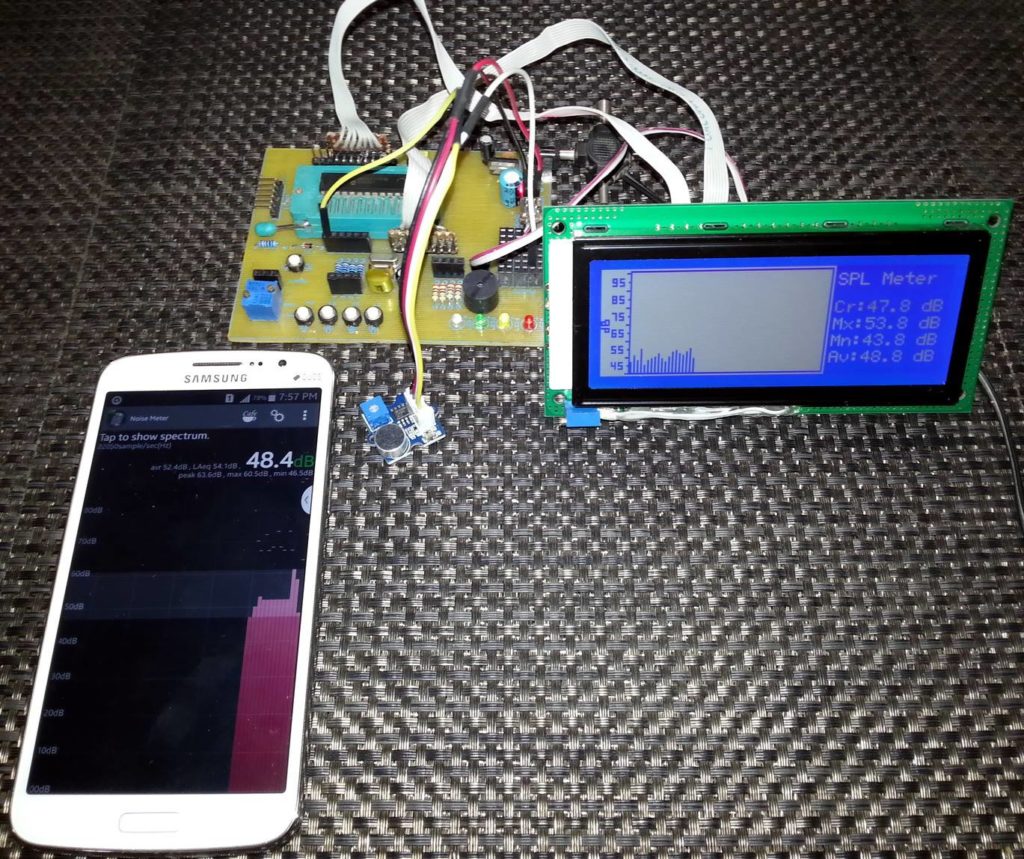
Now with the data processed, the data is ready for graphical presentation. The GLCD used here had a resolution of 192 x 64 pixels. It had three regions represented by three chip select (CS) pins. The first two regions were used for graphics while the third or the last region was used for text data.
Every graphical presentation has two components – one is the static background part and the other is the dynamic foreground part. In this code, the static part is the dB scale and the enclosure where the SPL bars graph is to be shown. This part as shown below is loaded only once right after initialization. The dynamic part changes with SPL values in the form of thin vertical bar graphs.
void display_redings()
{
    glcd_text57(130, 20, txt_dB_current, 1, OFF);
    sprintf(txt_dB_current, "Cr:%2.1g dB", db_current);
    glcd_text57(130, 20 , txt_dB_current, 1, ON);

    glcd_text57(130, 30, txt_dB_max, 1, OFF);
    sprintf(txt_dB_max, "Mx:%2.1g dB", dB_max);
    glcd_text57(130, 30 , txt_dB_max, 1, ON);

    glcd_text57(130, 40, txt_dB_min, 1, OFF);
    sprintf(txt_dB_min, "Mn:%2.1g dB", dB_min);
    glcd_text57(130, 40 , txt_dB_min, 1, ON);

    glcd_text57(130, 50, txt_dB_avg, 1, OFF);
    sprintf(txt_dB_avg, "Av:%2.1g dB", dB_avg);
    glcd_text57(130, 50, txt_dB_avg, 1, ON);
}

void plot_data()
{
   unsigned char l = 0;

   l = map(dB_current, 40, 99, 61, 2);

   glcd_line(x, 2, x, 61, YES);
   glcd_line(x, l, x, 61, NO);

   x += 2;
}


float map(float value, float x_min, float x_max, float y_min, float y_max)
{
    return (y_min + (((y_max - y_min) / (x_max - x_min)) * (value - x_min)));
}
As shown above the first function is responsible for displaying text data. The second function is responsible for plotting the bar graph. The region where a bar is to be plotted is cleared before plotting. This allows us not to fully refresh the screen. The map function is a straight-line equation solver and it comes useful in quickly translating from one range to another. For instance, in this case, the map function translates dB readings from 40 – 99 dB to 61 – 2 Y-coordinate position of the GLCD. Over 100 bars (X-coordinate points) together show the dB trend plot.
Improvements
A number of improvements can be made to the project. Some of these include:
- Using a more sensitive and professional microphone.
- Using a larger GLCD/TFT display.
- Using a faster chip for faster data processing.
- Adding a computer or mobile-phone application.
- Adding features like FFT data processing, spectrum display, etc.
- Adding a temperature and pressure sensor to take care of changes in medium with temperature and air pressure variations.
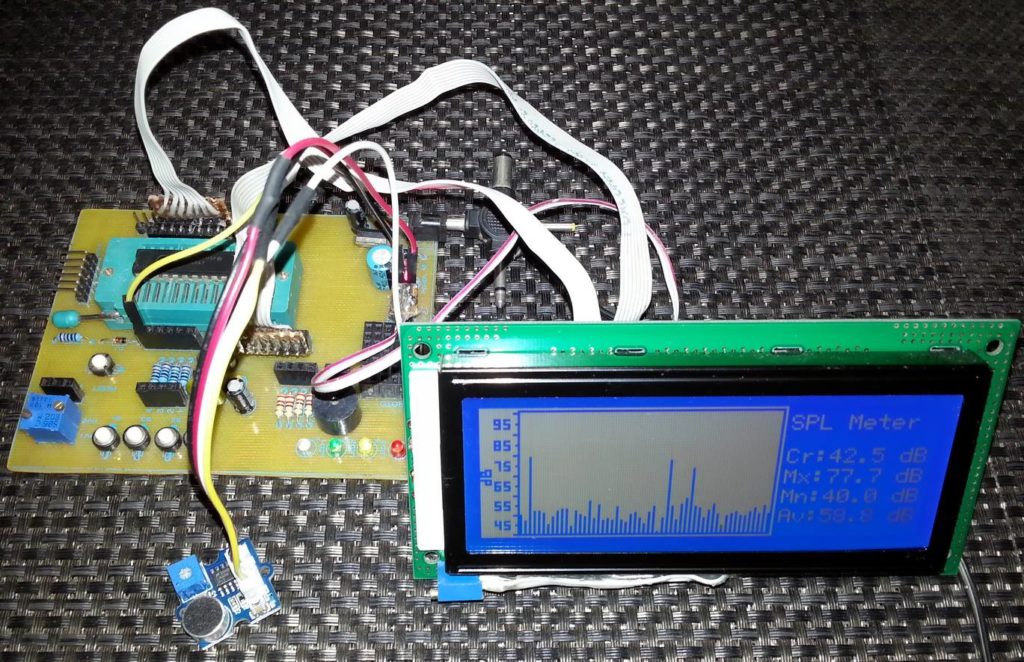
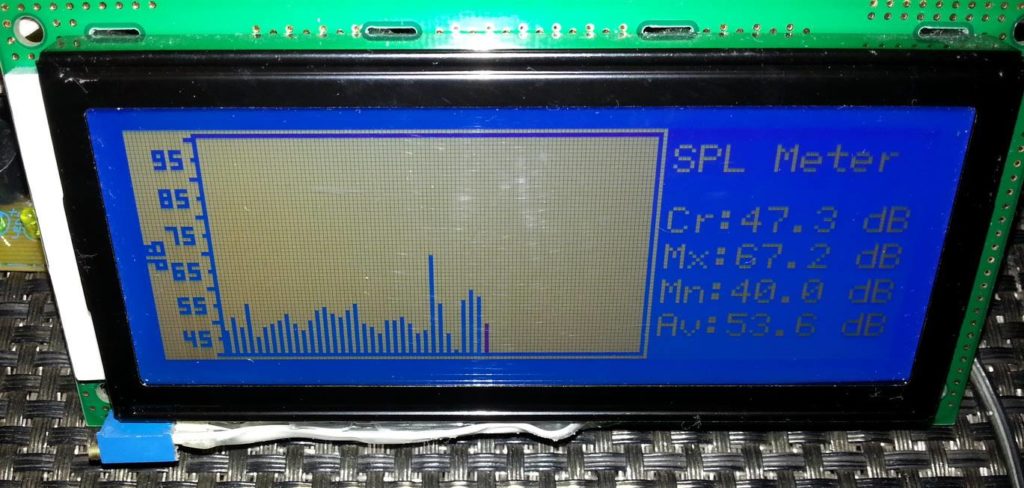
Demo
Resources related to this project can be downloaded from here.
Author: Shawon M. Shahryiar
https://www.youtube.com/user/sshahryiar
https://www.facebook.com/MicroArena
26.05.2015
|
|
This is a fascinating project with a great mix of theory and practical implementation. It’s always inspiring to see hands-on builds explained so clearly for others to learn from.
This is a fascinating project with a great mix of theory and practical implementation. It’s always inspiring to see hands-on builds explained so clearly for others to learn from.
A fascinating DIY electronics project. It’s impressive how detailed the explanation is, making it easier for hobbyists to follow along and build something functional while also learning more about sound measurement concepts.
This is a very informative and well-written article. I appreciate the effort you put into breaking down complex points into simple language. Posts like this actually help readers take action instead of just reading and forgetting. Keep up the great work.
“Such a well-written and engaging post! I could see the amount of effort you’ve put into research and structuring this blog. It gave me a new perspective and cleared up some doubts I had. Keep up the amazing work.”
Nice Information
Excellent post! You explained the topic in such a clear and practical way. I really liked the examples you added. Looking forward to reading more of your useful insights soon!
Wonderful blog! You’ve explained the topic with great clarity and provided useful takeaways. I especially liked the examples, which made it easier to understand. Looking forward to more amazing posts from you
Nice Post
Thanks for Sharing
Best Software Training Institute in Hyderabad
Thanks
hiii
hank you so much for your content..
Thank you so much for your terrific content!!
Uhm, I think the sensitivity of your microphone should be negative.
-50dB instead of 50 db. So, when you calculate the sensitivity in V/Pa, should be 1000 * 10^(-2.5) = 3.1623 mV/Pa equals to 0.0031623 V/Pa
Just like Seeedstudio, I found another electronic component distributor PCBONLINE.
Hi,
In the if statement below, you are assigning rather than comparing, should it not be if (db_current == 99) ?
Pardon me if i have misunderstood.
void read_SPL()
{
dB_current = adc_rms();
db_current = (ref_SPL + 20 * log10(db_current / sensitivity));
if(db_current = 99)
{
dB_current = 99;
}
Typing mistake… it should be >= 99…. Thanks…. 🙂
Pingback: Make Your Own SPL DB Meter With A Microphone And MCU
Pingback: Make Your Own SPL DB Meter With A Microphone And MCU – Hack A Day
Pingback: DIY dB Meter Made with a Grove Sound Sensor and a PIC MCU | iotosphere - Internet of Things
Pingback: Making a SPL dB meter – gStore